I seem to end up spending a lot of my time looking for vulnerabilities in PHP applications. Until fairly recently, my process for this mostly consisted of reading the code (duh), navigating either manually or via Github’s surprisingly-good References feature. I used to sometimes import large projects into an IDE for this functionality, which I’m glad I don’t have to do anymore.
Along with this I make quite heavy use of ripgrep and phpgrep to assist in finding what I’m looking for. I’m still working on efficient use of phpgrep actually, I can’t decide if I love it or not yet.
At some point, though, I’d end up in the position of inserting var_dump() and
die() calls to better follow what’s going on or to test a hypothesis. And while
there is certainly a place for print-debugging, when it becomes a core part of
your workflow, maybe it’s time to improve things. Besides, there’s all sorts of
scenarios where it can cause issues - everyone has had the experience I think of
putting a var_dump() or similar somewhere, not realising it would get included
in a JSON response, and breaking the page. Sometimes, friends, we must
suck it up and use a real debugger like those weird binary exploitation people.
Coincidentally I have also switched my main development machine from Linux to Windows as well, so my mission was clear - can I get an awesome PHP audit environment, that runs on Windows, has a real debugger, and doesn’t rely on any heavyweight tools?
Step 0: Have a local environment for running PHP.
OK, you probably already do, if you’re reading this. But, I want to make a suggestion: Use Windows as your development OS, and then use WSL2. You may be recoiling right now, and if so, I understand, keep using your Mac or Linux machine. But, I changed to Windows recently. And this is my setup guide.
If you haven’t tried WSL since WSL1, it is actually fantastic. Despite using Windows now, I am in a WSL2 terminal pretty much all day for ‘real work’, but my graphical tools (editor etc.) are Windows.
For my hacking environment, I have mod_userdir configured to serve a directory from my home directory and I just install the vulnerable applications there. You can configure that like this, except you don’t need to use the
add-apt-repositorylines, just use the default packages.Step 1: Use VSCode as your editor.
I am a Vim die-hard. Switching to VSCode like all the cool kids were doing was a no-no for me. Then I did, and it turns out it’s excellent, so whoops. For this use, the primary reasons are: it has WSL2 integration that just works, so when you open a project in WSL2, it handles all of the WSL2 magic transparently, including starting the instance if it’s not running, installing any extension files needed, etc. And it has a graphical debug interface, which is kind of the point here. I do still use Vim emulation for keybinds, though, I don’t think that will ever change.
Step 2: Install the Xdebug PHP extension.
We need to install the Xdebug PHP extension, which enables step debugging, amongst other features. You can choose to either use Xdebug version 2, which is installed in the Ubuntu distribution supplied with WSL, or you can install Xdebug version 3.
Both will work with the debugging extension we use later on, but the Xdebug team no longer support version 2. I have only recently started to use 3, myself, so I include both instructions here in case you have any problems with 3 I don’t know about - however I recommend trying to use 3 first, and only using the unsupported version if you need to.
Version 3 (Recommended)
We can’t simply install Xdebug from APT, because the version of Ubuntu that WSL ships currently (assuming you’re not using your own distro) doesn’t include a currently supported Xdebug. So, we will install it from PECL:
sudo apt install php-pear php7.4-dev
sudo pecl channel-update pecl.php.net
pecl install xdebug
Then edit (or create, if not present) the file
/etc/php/7.4/mods-available/xdebug.ini:zend_extension="/usr/lib/php/20190902/xdebug.so" [xdebug] xdebug.mode=debug xdebug.start_with_request=yesYou should double check the zend_extension line above! The appropriate path to use will be given to you from the
pecl installcommand, follow its directions if they differ from mine in this regard.Then run
sudo phpenmod xdebugandsudo service apache2 restart.You will notice the configuration is different to 2. There is a good document on the changes.
Version 2 (Unsupported)
You can simply run
sudo apt install php-xdebugto install the extension.The required configuration is different, use the following:
xdebug.remote_enable = 1
xdebug.remote_autostart = 1
xdebug.remote_port = 9003
And then
sudo phpenmod xdebugandsudo service apache2 restartas above.
This setup basically tells Xdebug to automatically run on every PHP script, and try to connect to a frontend using the default settings. You probably shouldn’t do this on a production server, but on a development box it works fine. Even if the frontend is closed or not debugging, it will still complete the request.
Step 3: Install the VSCode extension
Now you should go to Extensions in VSCode and install the extension ‘PHP Debug’ by Felix Becker. This is the adapter that hooks up Xdebug to the VSCode UI.
It uses the default Xdebug parameters, so you don’t need to configure anything here.
Step 4: launch.json and ‘wait for debug’
You will need a
launch.jsonfile, which is VSCode’s way of specifying debug targets. If you head to where your application is installed in a WSL2 Terminal and runcode, this will open the project in WSL2 and install any necessary components. Then, press ‘Run and Debug’ on the left bar (looks like a play button with a bug next to it) and click ‘create a launch.json file’ and then ‘PHP’. This will create the default file for you in your project directory, which is fine. There is, apparently, a way to get this to happen as an app-wide default without needing to generate a file per-project, but I didn’t manage to get it to work. I will update this in future if I do.Set a breakpoint in your application by clicking to the left of the line numbering on a line that you are interested in exploring. You will get a red dot to show a breakpoint has been set. Now click ‘Start Debugging’ in the Run menu and your VSCode will switch to the debug view with ‘Listen for Xdebug’ in the status bar.
Make a request to your application which hits that breakpoint, in your usual browser.
Step 5: Hack some stuff.
If all went well, you will see something like this:
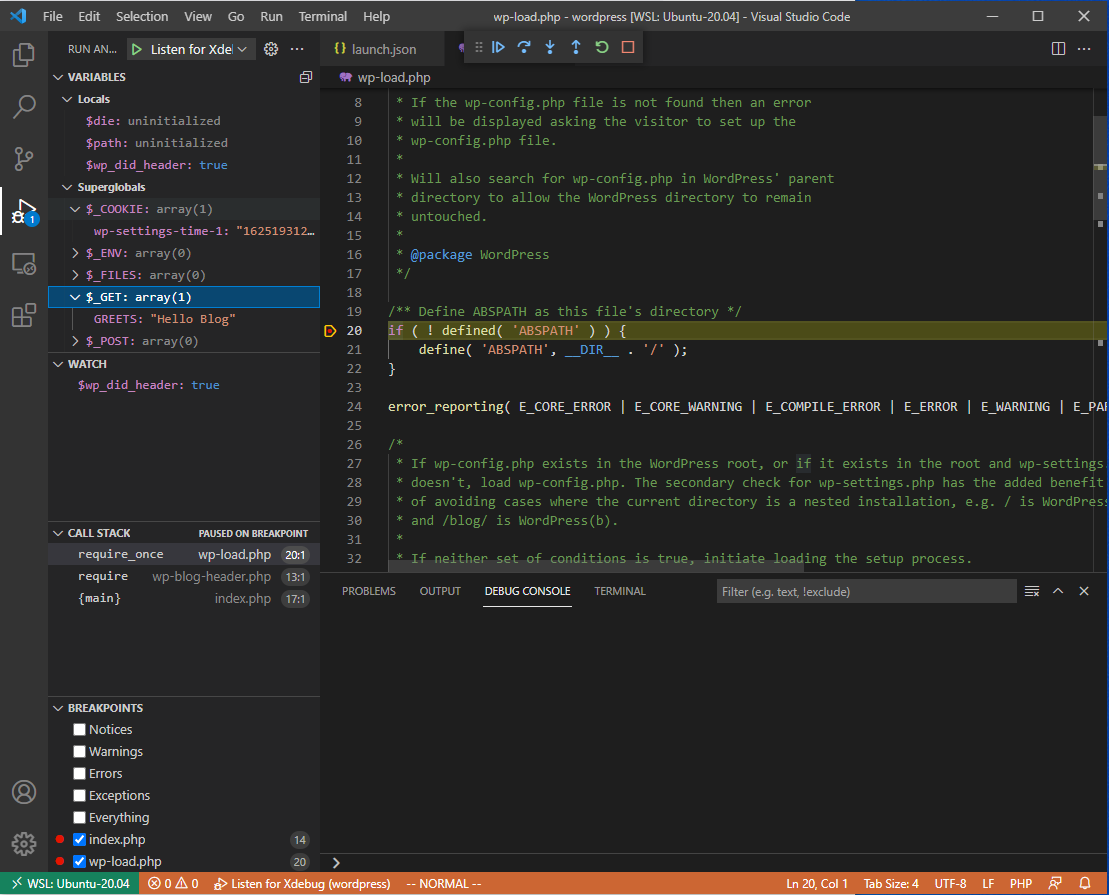
If you have used a debugger before, this will look delightfully familiar. If not, some features of note:
- The code is shown in the place it normally is. You can navigate through this using the pop up debug bar at the top or the appropriate keyboard shortcuts. Step Over means ‘run the code at the line I’m pointing at and don’t take me through it’, such as if it’s a library function you don’t care about. Step Into means, ’no I do care about it, take me through that step by step as well’. Continue means ‘stop going step by step and run until the next breakpoint’. Step Out means ‘run until we return from the function we are in, then go step by step again’.
- The Variables window in the top left shows all of the variables in scope at the
moment and their values. You can right click these to add them to the Watch window below, if they are
important and you want to keep an eye on them. Notice you can view the
superglobals such as
$_GEThere. - Underneath the Watch window you have the call stack. It tells you how you got to where we are now, ie, what was called in order to reach the current function.
- In the Breakpoints window you can quickly toggle any breakpoints you have set. You can also choose to break on any error/exception/warning, instead of a specific line of code.
At some point I’d like to do a video on how this can improve bug hunting efforts, but hopefully like me some of you had been looking for a nice environment for PHP debugging and can make use of it!